Stocks
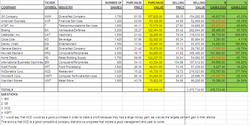
In this assignment we had to create a chart on stocks for different types of businesses, to show people what stocks were doing the best, which were alright, and which companies were suffering. This information allows people to make the best decision on which company to invest in. The technologyskills I had to use in this assignment were all on Excel. I had to use skills from past assignment such as; auto sum and fill-down tab to copy formulas in columns. The new skills I had to use were formatting cells to negative numbers, and changing the cell’s fill color for added emphasis on the most important parts. By creating this piece of work I learned about stocks, and how they affect a business based on the money gain/loss, as well as the company’s percent gain/loss. The things I did well in this assignment were efficiently entering companies stock information into an organized table as well as formulating their purchase value, selling value, money gain/loss, and percent gain and loss. To improve my work on this project I could have chosen a different color scheme. The one I chose was what was directed for me, but the colors don’t intrigue the reader. They are somewhat boring, so I could have chosen a yellow and a green still, but I would have changed the fade or format to make the shading more appealing.
Excel #22
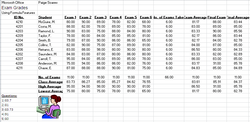
In this assignment we had to use an Excel document to show the test scores, averages, and class average of eleven students. To complete this assignment we had to use certain technology skills such as using formulas in Excel, shortcuts to make the process faster, as well as inserting a piece of clip art. By creating this piece of work I learned how to efficiently create a class roster and figure out what the highest, lowest and class average for the given test scores were by using the average formula. In this assignment I successfully added in a piece of clip art, answered five questions related to the assignment, and processeed the information. If I could go back to change what I did in this activity would change the colors to enhance the picture for the viewer.
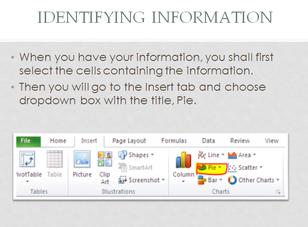
Group Activity
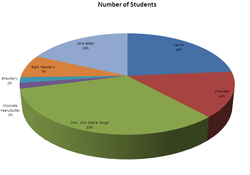
In this activity we were put into groups of three to teach the class how to create a certain chart in Excel. To complete this assignment we had to effectively and efficiently collaborate with our peers to benefit the whole class, and apply our technology skills that we've learned to create a new topic we haven't yet learned. By creating this piece of work I learned how to better my people skills. Being the oldest in the group, and a senior, I took on the role of being responsible and the leader, to show my peers that I'm a good role model. In this assignment I successfully created an acitivty for the class while my group members worked on a PowerPoint document to explain how to make the chart in Excel. If I could go back to change something I did in this activity I would have collaborated more with my group members, and explained why you would use a pie chart in more depth. Also, by doing these group projects the whole class benefitted by inproving their listening skills. In order to actually learn how to create each chart that you can in Excel form our peers we had to show them respect during their presentation, and communicate with them after their presentation while creating their example chart. This opened up my eyes because if I had a question on a certain part of that chart I had to ask my classmates instead fo the teacher, that is something I've never had to do before.
iPhone Games
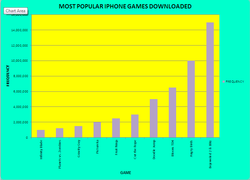
In this acitivity we had to create a two column chart of data in Excel which showed the most popular iPhone games, and then create a bar graph to show the frequency that each game was used. To complete this assignment I had to use the skills I developed from listening to my peers presentations, and then using the information to create a column chart independently. By creating this piece of work I enhanced my knowledge on how to create column charts. In this assignment I effectively followed the directions and made a chart I am proud to share with the teacher to prove that I do in fact know how to create a column chart in Excel from scratch. If I could go back to change something in this activity I would probably try to use more shortcuts, as well as change the color effects. By doing this I would have completed the activity faster, and it would look more appealing to the eye if I had selected colors that meshed together better.
Yacht Mortgage
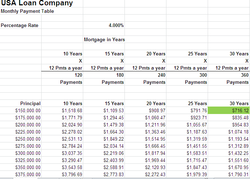
In this activity we had to create a spreadsheet showing how much money we would pay back on different mortgages for 10-30 years, depending on how much the yacht was and how many years we planned to finance the yacht. To complete this assignment we had to use a new formula on excel known as the payment formula.
This formula helps us to calculate the amount of money we need to pay on the morgage for a set amount of years. By creatign this piece of work I learned how much money you actually will pay back on a mortgage. This will be helpful in the future when I plan to buy a house because I will be aware of how much money is actually involved. In this assignment I effectively learned about mortgages and how they work. If I could go back and change something about this activity I would probably change the coloring that way I would be able to see the different mortgages more easily.
This formula helps us to calculate the amount of money we need to pay on the morgage for a set amount of years. By creatign this piece of work I learned how much money you actually will pay back on a mortgage. This will be helpful in the future when I plan to buy a house because I will be aware of how much money is actually involved. In this assignment I effectively learned about mortgages and how they work. If I could go back and change something about this activity I would probably change the coloring that way I would be able to see the different mortgages more easily.
